
INAUGURAL ISSUE
Greetings friends and colleagues! As we embrace the new year, it’s the ideal moment to reassess the business landscape. Join us for the inaugural issue of “The Strategic Spark” Newsletter, a must-read delving into the realms of business, strategy, communications, marketing and more.
Our mission is to empower business owners, creative minds, and innovators into producing and promoting greater success. The “The Strategic Spark” Newsletter is dedicated to you and the good people who have been a part of Lightspeed’s success.
You are encouraged to share this valuable resource with your family, friends, co-workers, colleagues, and business associates. Your dreams and goals are at the core of our focus, and we treasure your feedback. Connect with us – talk, write, or call. We thrive on hearing from you! — Mike and the Lightspeed creative team
Read Time: About 6 minutes — Written by Mike Hamers
Get to Meaningful Results FASTER
with Infographics: Data Visualization
“A good sketch is better than a long speech” — Napolean Bonaparte
A poet (writer) would be”overcome by sleep and hunger before being able to describe with words what a painter [artist] is able to depict in an instant.” — Leonardo da Vinci
We know Florence Nightingale for her kindness and tender nursing care, but she saved countless lives because she created statistics-based graphics to convince hospitals to reform nursing with superior germ-fighting procedures! Her Nightingale Rose Diagram (publ. 1859) helped shape modern infographics AND dropped hospital mortality rates from 40% to 2%
“A picture is worth a thousand words.”
This axiom has survived the test of time for a reason. Images were, after all, the first way that people preserved their experiences for future generations. Neanderthals created the earliest cave paintings approximately 64,000 years ago. Later came the Egyptian hieroglyphic system of writing with symbols to convey ideas (3,100 BC). But the evolution of humans and technology hasn’t reduced the importance of visuals to tell a story. If anything, the ongoing explosion of data in the Digital Age has cemented the importance of data visualizations.
Make a memorable impact with data visualization
they will go in one ear, sail through the brain, and go out the other ear.
Words are processed by our short-term memory where we can only retain
about 7 bits of information… Images, on the other hand, go directly
into long-term memory where they are indelibly etched.”
Research supports this claim –
Here’s Why Infographics are Important
Both short- and long-term memory store information in chunks, but short-term is limited. One of the easiest ways to ensure that your audience stores information in their long-term memory is to pair concepts with meaningful images. Visuals like infographics help people make sense out of content which increases the possibilities that they will remember the material.
2. Visuals Transmit Messages Faster
• The brain can see images that last for just 13 milliseconds.
• Our eyes can register 36,000 visual messages per hour.
• We can get the sense of a visual scene in less than 1/10 of a second.
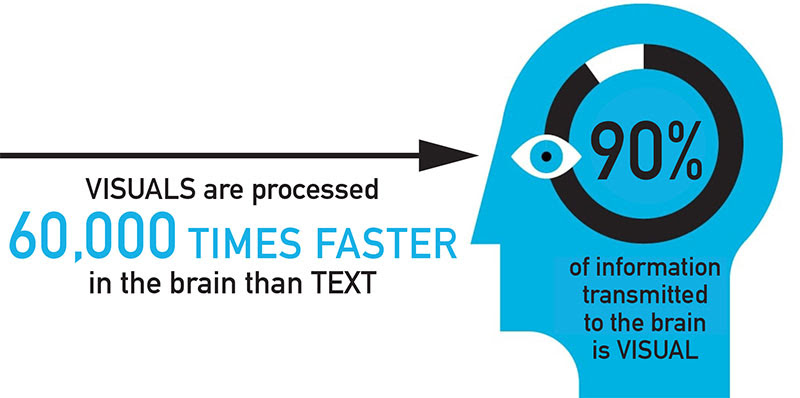
• 90% of information transmitted to the brain is visual.
• Visuals are processed 60,000 times faster in the brain than text.
• Graphics are 3xs more likely to be liked & shared than other social media content.
10 Types of Data Visualizations to Consider
- STATISTICAL – Visualize survey results; present data from multiple sources
- INFORMATIONAL – Communicating a new or specialized concept
- TIMELINE – Visualize history, dates, events – timelines or milestones
- PROCESS – Overview of steps or a sequence – flow diagram, decision tree
- GEOGRAPHIC – Maps; location-based data – demographic data trends
- COMPARISON – Picking between multiple options – comparing pros & cons
- HIERARCHICAL – Organized greatest to least (Food Pyramid / Maslow’s Pyramid)
- LIST – A collection or list of tips, resources, or examples; bulleted or numbered
- PHOTOGRAPHIC – Images show “before & after”; used to visualize a change
- ORGANIC MAP – Words or concepts linked to & arranged organically around a central concept, more flexible and creative, used for brainstorming (mind maps)
3 Ways Infographics Deliver Value for Business
1) IMPROVED PATTERN RECOGNITION: Looking for patterns is human nature. But with huge volumes of data, finding patterns is more challenging. Data visualization tools remove the heavy lifting. Consider a simple spreadsheet. Whether it has 100 lines or 1000, finding patterns in tabular data requires a lot of time and effort. Creating a chart lets you see patterns and trends more easily — be they marketing trends or scientific data points.
2) FASTER TIME TO INSIGHT: Visuals don’t just make data easier to remember, they make it easier to separate what matters from the noise of big data, especially when you’re creating visualizations in real time.
3) MAKES BIG DATA AVAILABLE FOR ALL: Not everyone has the skills or inclination to sit down with a pile of data and filter through it to find answers. Data visualizations allow for collaboration across your organization, driving insights from consolidated data.
Summary
When thoughtfully used, data visualizations help you tell a more compelling story, with important context, so users across your business can get the big picture, absorb meaningful details, and use those insights to inform decisions.
MIT Sloan lecturer Miro Kazakoff wrote: “If you want people to make the right decisions with data, you have to get in their head in a way they understand. Throughout human history, the way to do that has been with stories.” Preferably, with images, so that the data stories you tell will stick in your colleagues’ and C-suite’s’ minds.
The team at Lightspeed can help create visual solutions for both academic and business needs. Here are some examples of our work.
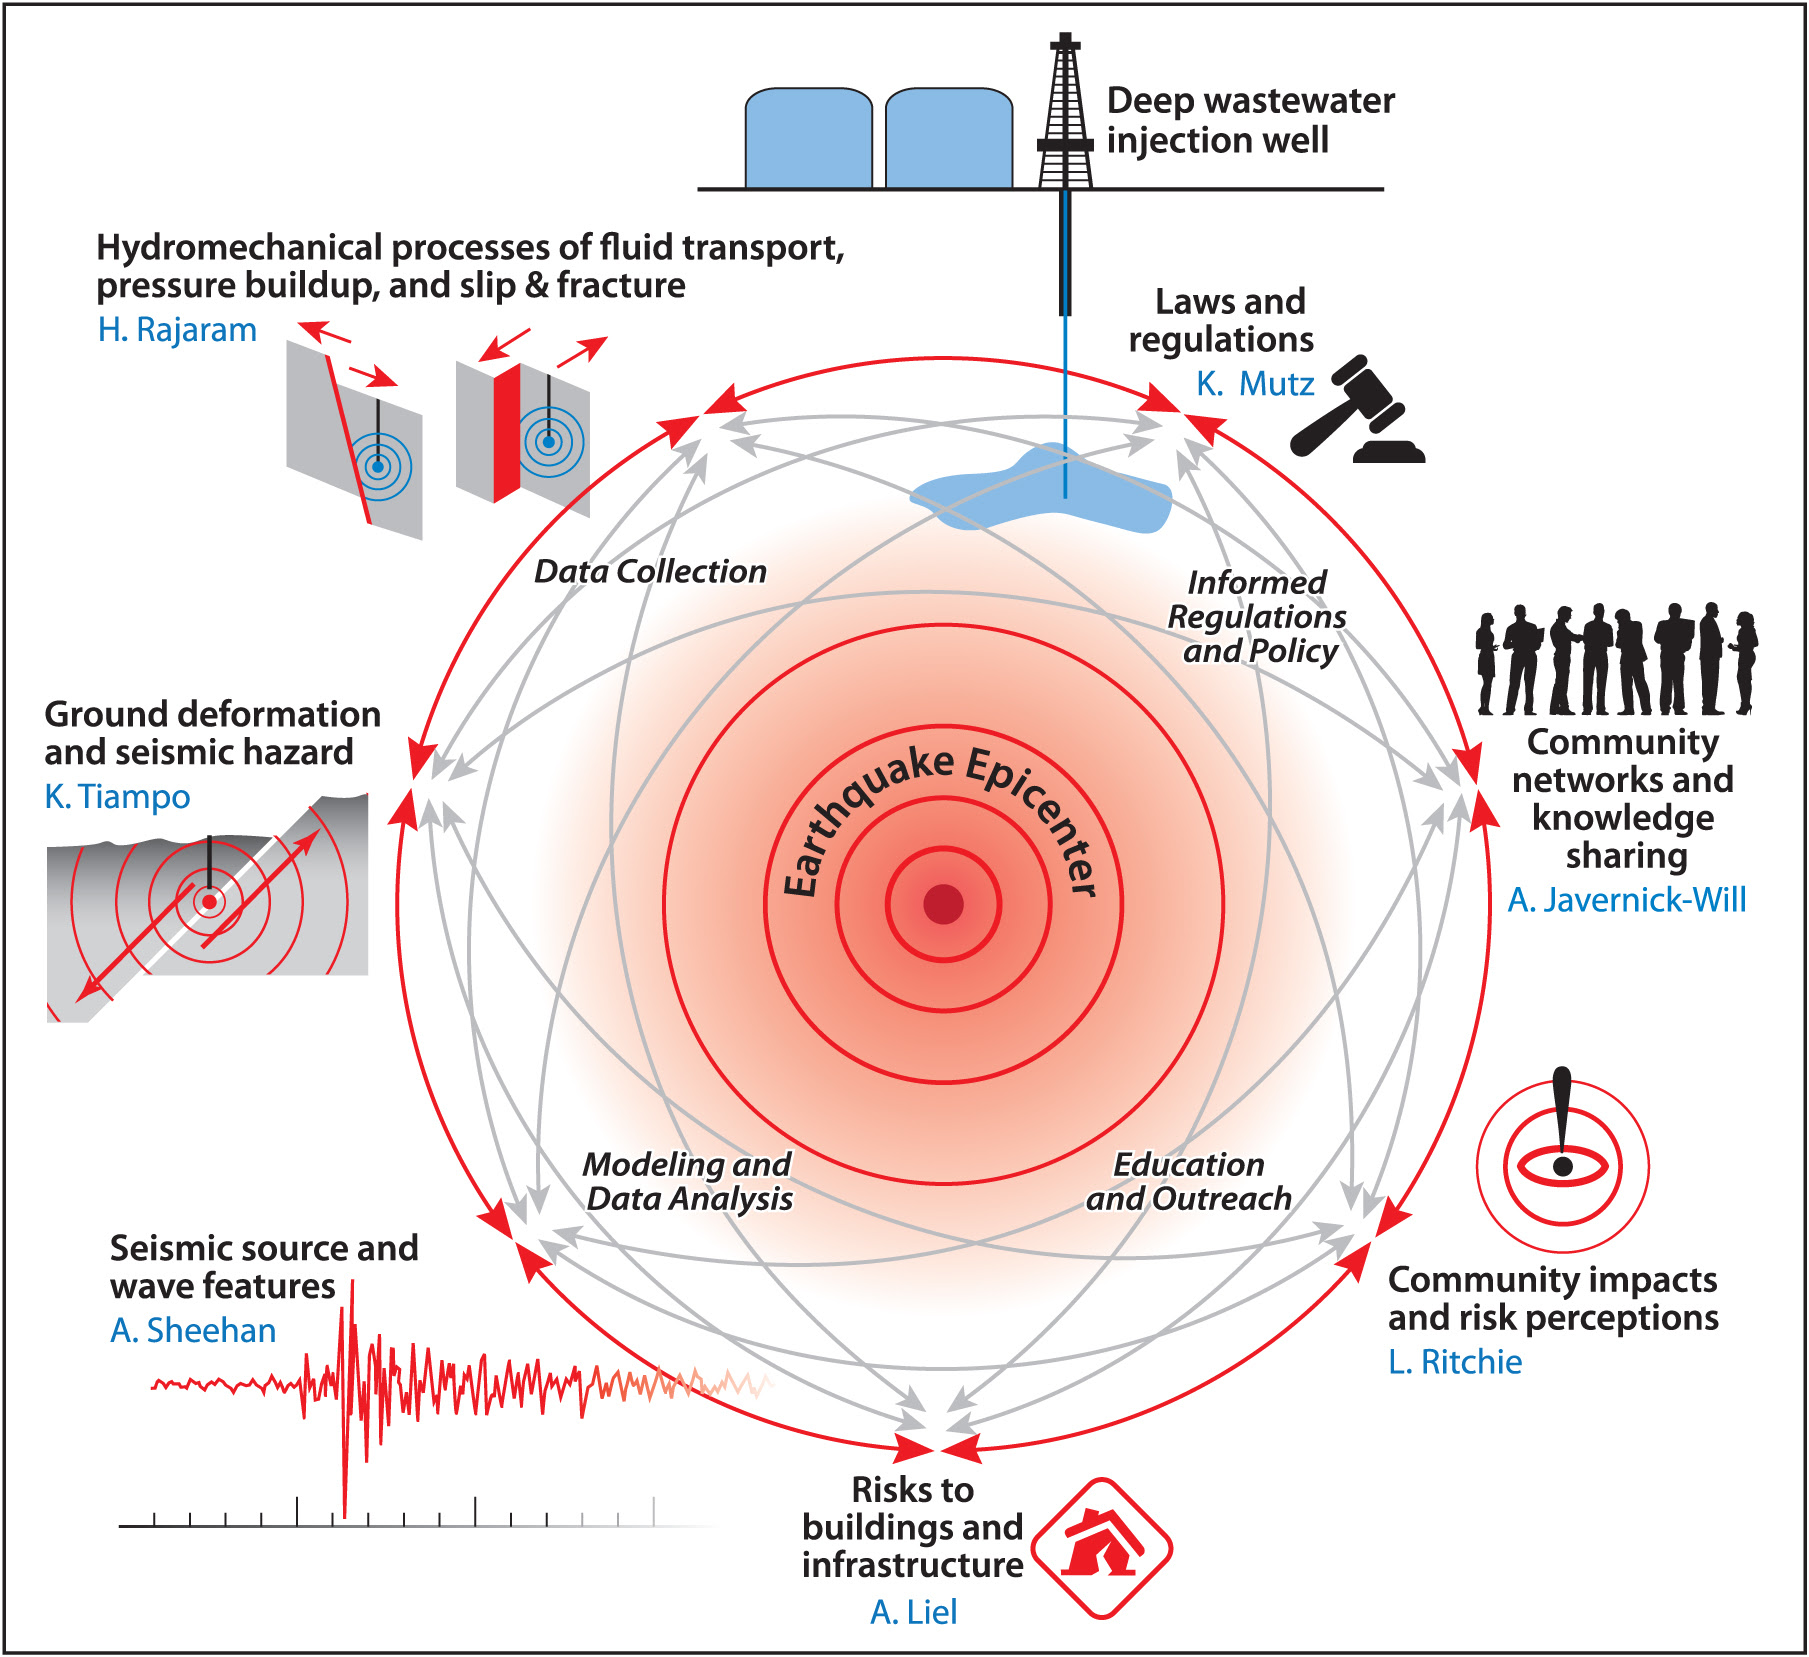
Informational / Concept Infographic – “Fractal Drilling-Induced Earthquake Ramifications” — This graphic shows the interrelationship between eight specialized earthquake research groups. The center shows the types of data that is exchanged between the groups along with the name of the lead project manager for each group. (For the Univ. of CO — from pg 77 of “SPARK! Fuel Your Creative Fire”.)
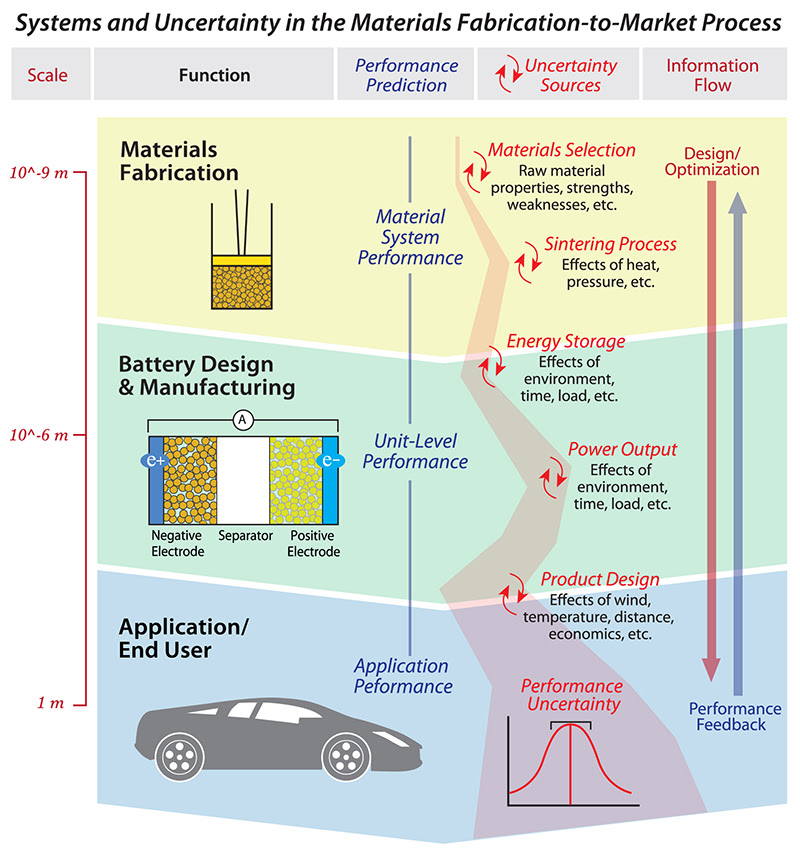
Informational / Process infographic – “The Accumulative Effects of Uncertainty Factors in the Development of Unique Nanotechnology Materials”
– This infographic includes 6 important factors: Scale (nano/micro/meters), Unit Function, Visual Icon, Performance Predictions, Uncertainty Sources, and 2-way Information Flow. (From page 76 of “SPARK! Fuel Your Creative Fire”.)
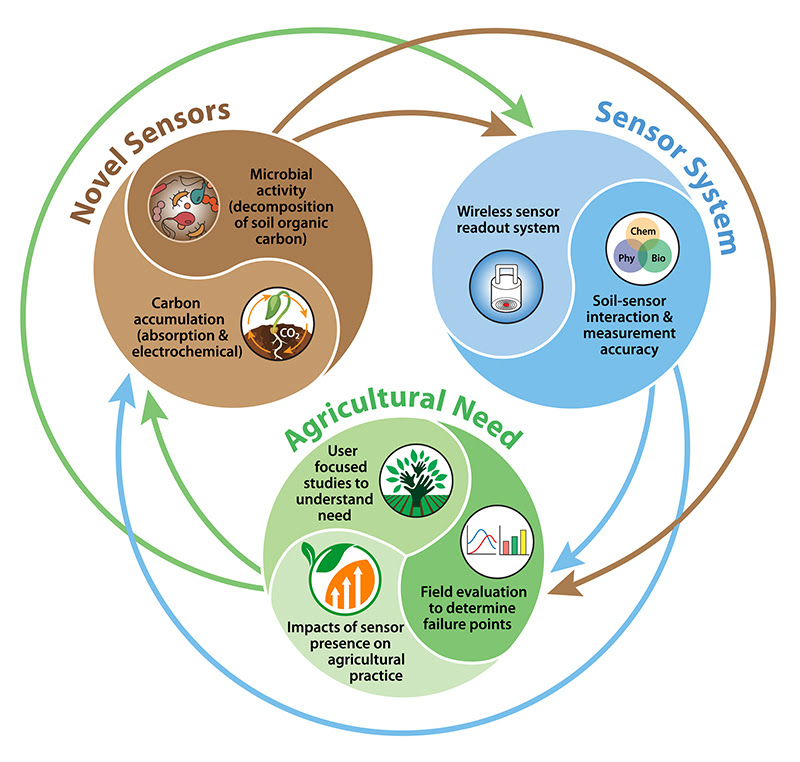
Informational Infographic – “Soil Carbon Assessment using Novel Sensors (SCANS)”— Infographic create for a NSF proposal related to use of electrochemical organic carbon sensors in soils and regenerative agriculture locations, that monitor real-time soil organic carbon decomposition and soil organic carbon accumulation, with the ultimate goal of improving soil carbon stocks and overall soil health for agriculture and food production.
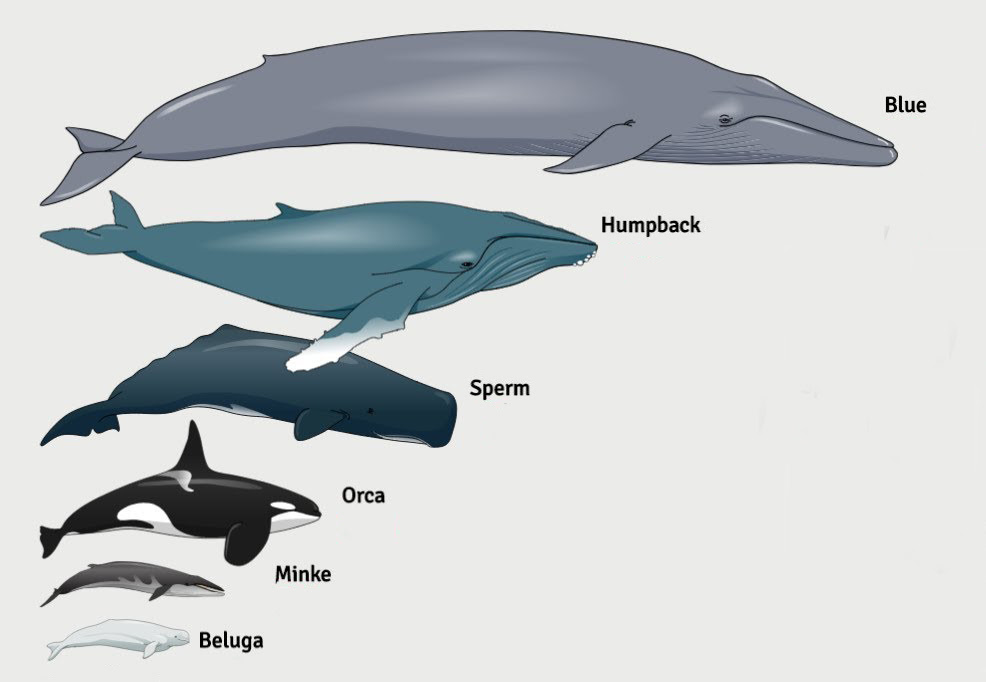
Hierarchical / Photographic Infographic – “Whale Scale”: Visual comparison of whale sizes from largest to smallest.

Organic Map / Resume Infographic – Informal resume that focuses on the person’s skills, interests, and experience without timeline or employer specifics.
Previous Newsletters
Is Your Brand & Logo Aligned with Your Core Values and Current Market Trends?
Is Your Brand and Logo Aligned with Your Core Values and Current Market Trends?Recently, one of our long-standing clients, who has been a wonderful advocate for our services, approached us with a request to evaluate, revisit, and refresh their brand strategy and...
The Unsung Hero of Content Engagement: Graphic Design
The Unsung Hero of Content Engagement: Graphic DesignIs our content truly engaging without graphic design? Research suggests it does not.According to Forbes, content with relevant images gets 94% more views than content without images, and social media posts...
Postcard Marketing Still Thrives in a Digital Age
The Enduring Effectiveness of Postcard Marketing in the Digital EraAs technology continues to reshape the landscape of business marketing, certain timeless strategies prove to withstand the test of time. Among these enduring methods is POSTCARD MARKETING, a...
10 Brand Identity/Logo Design Mistakes and How to Avoid Them
When executing your brand strategy, creating a successful logo design is one of the most significant elements of business development. In addition to presenting your name to potential customers, your logo is used to convey professionalism, your company values, and...
If you’re looking for guidance on how to plan your next infographic,
contact Mike at: mike@lightspeedca.net for call 303-527-1222.
Buy the book today: “SPARK!” Offers Valuable Strategies & Solutions for Every Leader, Executive & Entrepreneur
An inspiring guide that delivers more productivity and money-making tips per page than any book on creativity ever published.

In this brilliant book, the author and contributors offer hundreds of ideas and strategies across a wide variety of business and industry types. Featuring examples from their vast and impressive collection of award-winning designs and illustrations, Mike Hamers, founder of Lightspeed Design Group, follows a consistent format and thought-provoking theme throughout the book.
“SPARK!” is compelling, engaging, and flawless in its tactics and strategies and includes examples from science, technology, finance, nutrition, and professional services, this book is a must-read for every business owner, CEO, executive, engineer, producer, author, art director, graphic designer, and advertising and design student.
Futurist Thomas Frey wrote, “We have worked with Lightspeed on a number of occasions; for book covers, technical drawings, and logos. The DaVinci Institute logo in particular was a stroke of genius. I’ve always been enamored with Mike’s ability to both surprise us with his designs and “WOW” us with the ingenuity he used to create them!”
SPARK! by Mike Hamers, is available exclusively on Amazon.com.
Or to read more first, visit https://www.
LIGHTSPEED DESIGN GROUP
www.Lightspeedca.net • 303-527-1222
A Graphic Design and Marketing Firm

Located in Longmont, CO, Lightspeed Commercial Arts stands as a distinguished powerhouse in the realm of graphic design and visual communications. Founded by Mike Hamers, our team boasts a wealth of expertise, delivering professional design and illustration services tailored to meet the objectives of our discerning clientele.
At Lightspeed, we specialize in a spectrum of services, including web design, logo creation, and technical & science illustration. Our prowess extends beyond conventional graphic design; we are trailblazers in the realms of printing, publishing, and branding. Our comprehensive suite of design and marketing solutions serves as a catalyst to accelerate and validate your entrepreneurial visions.
Our commitment? Propelling your business forward. Through a visionary lens, we transform ideas into tangible realities, whether it’s crafting captivating websites, specialized illustrations, compelling brochures, attention-grabbing postcards, or immersive trade show booth designs.
Gone are the days of maintaining an in-house creative department for many businesses; Lightspeed revolutionizes the design landscape. Consider the possibilities – what can we create or refine for your business?
Discover how our expertise can elevate your brand and accelerate your success. Reach out today and witness the transformative power of Lightspeed’s creative solutions.
Email or call Lightspeed today • mike@lightspeedca.net • 303-527-1222
