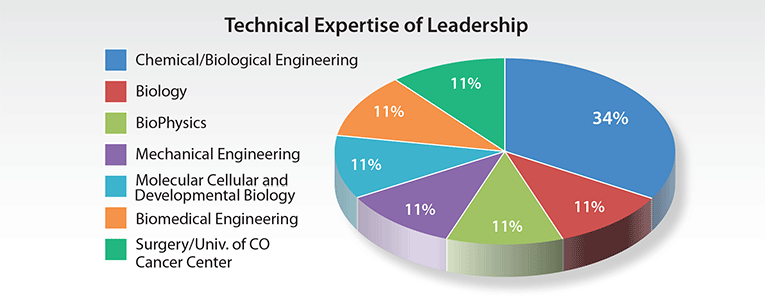
PIE CHART: DEMOGRAPHICS OF TEAM COMPOSITION
CUSTOMER:
Univ. of CO, School of Advanced Engineering and Applied Science
PROJECT DETAILS:
This pie chart shows the proportional divisions of the Technical Expertise Leadership involved in the new specialized area of Personalized Medicine.